
Spoiler Alert: Cars Are More Complicated than Toilet Paper
In April 2020, just weeks into the COVID-19 pandemic, a strange thing occurred. Almost overnight, grocery store shelves were stripped of paper goods, with nary a shred of TP to be found. Back in the day, I personally witnessed two men coming to blows in a Target aisle because one had taken a roll of paper towels from the other’s cart.
In the heart of that era, I remember finding a pack of toilet paper at a local convenience store, and I willingly and (I’m a little embarrassed to admit) joyfully paid $12 for six small rolls of one-ply to tide us over until the Georgia Pacifics and Procter & Gambles of the world could get their act together and ramp up production to meet the surge in demand. Ah, the joy of economics.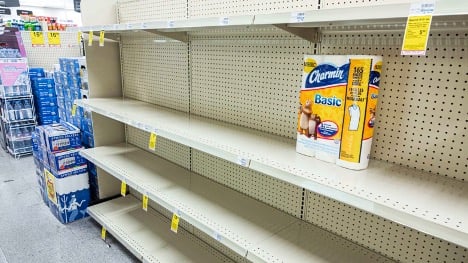
Source: The Daily Beast, “We’re Back in the No-Toilet-Paper Phase of COVID-19”, November 17, 2020
Within a few months, paper products were more readily available, though each surge in virus cases caused people to scurry to the store to stock up again. The good news is that paper products were and remain relatively uncomplicated, delivery logistics are pretty straightforward, and the low price point limits the long-term effects on consumer dynamics. In other words, the shortages worked themselves out to rebalance supply and demand in relatively short order.
None of those elements are true in the automotive industry, and the cyclical nature of marketplace dynamics takes much longer to sort themselves out. The effects of COVID-19 continue to play out years after the initial breakout, with the pendulum swinging in slow motion, going from supply-driven to demand-driven and now heading back to the former.
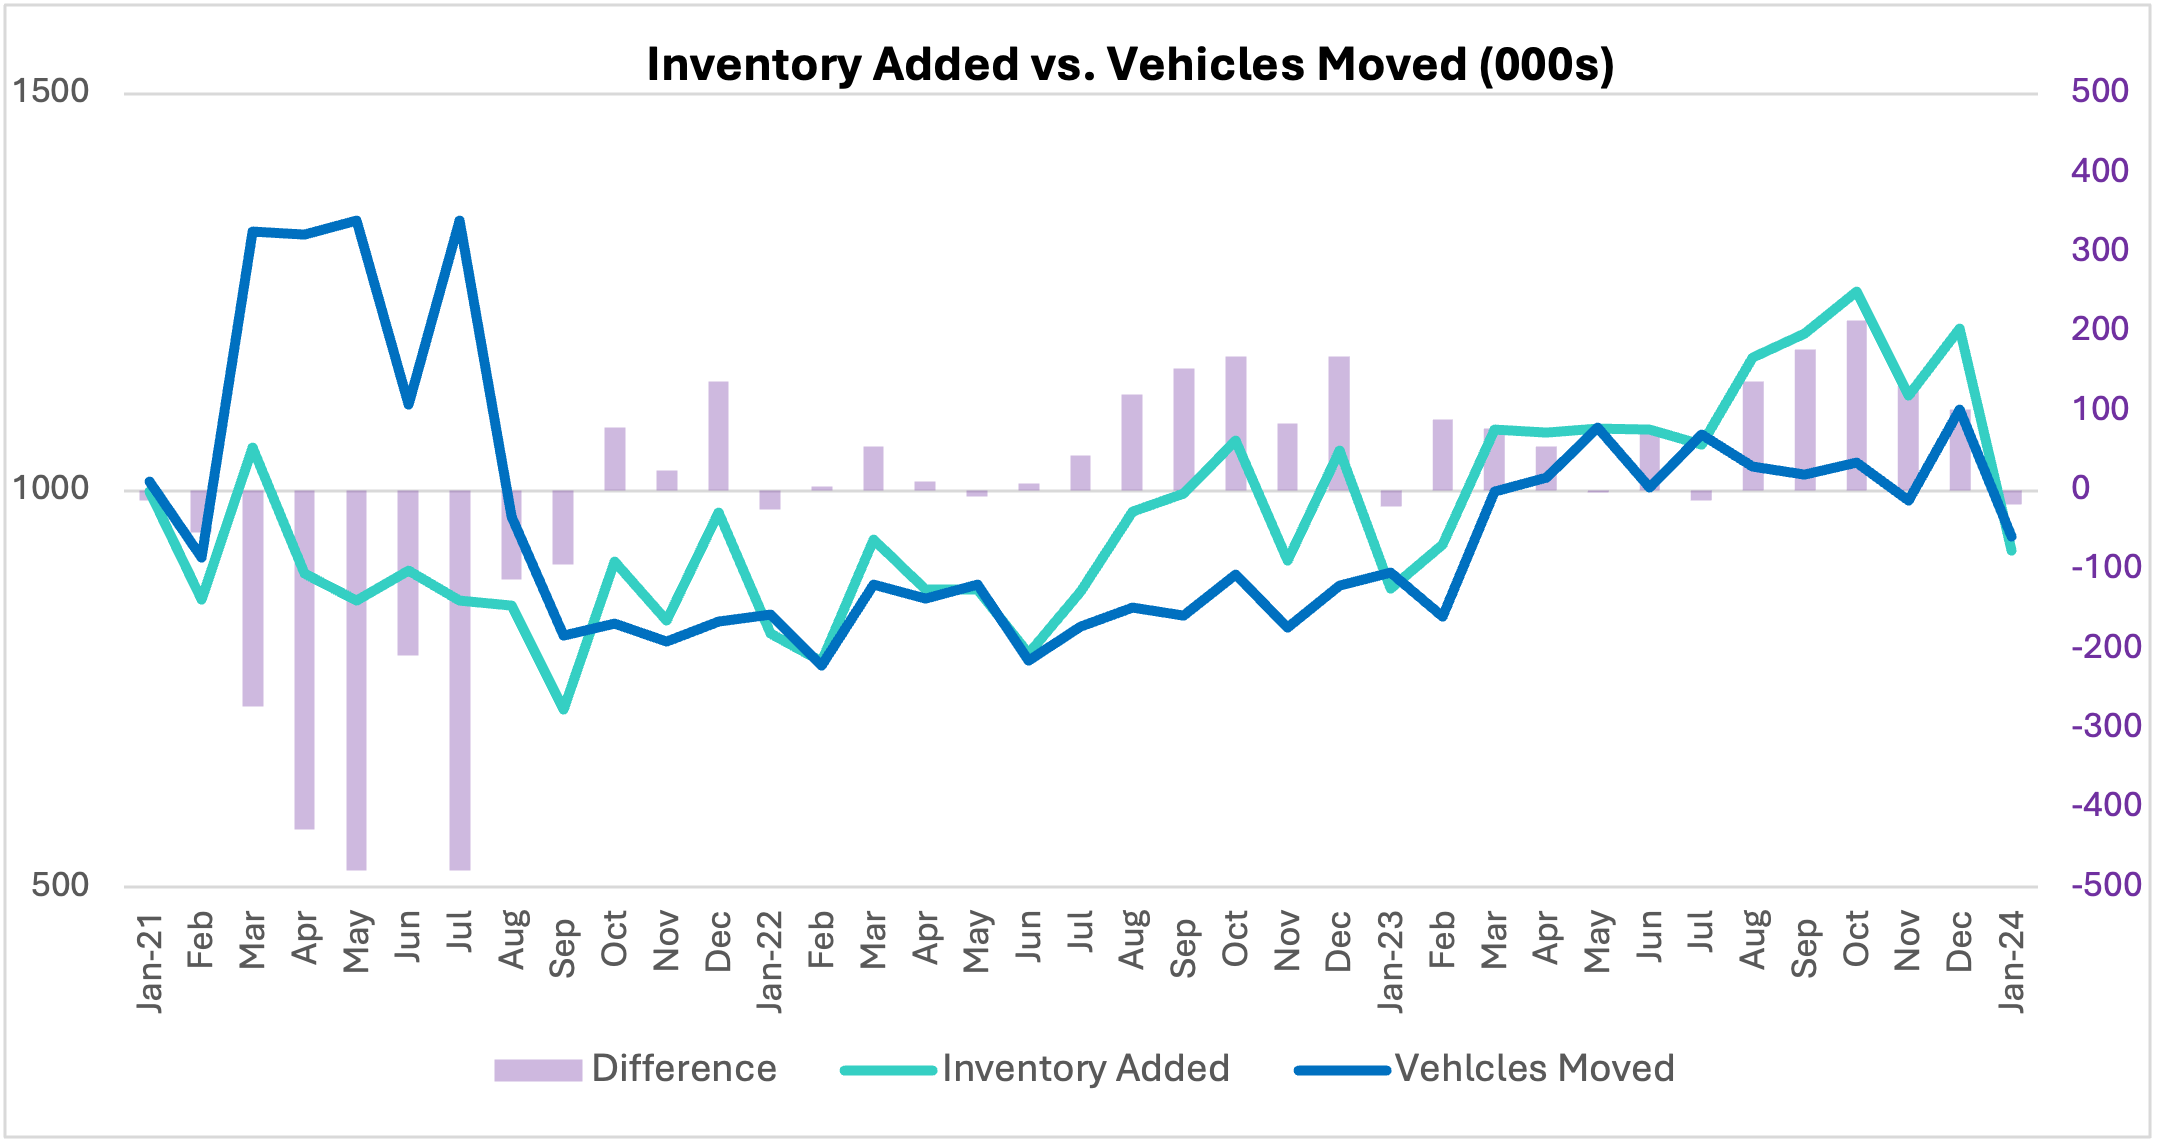
One way to understand these automotive industry dynamics is to compare the level of new inventory being added with the number of vehicles moving–in other words, the inflow of supply and the outflow of demand.
For the first nine months of 2021, for example, the number of vehicles moved far outpaced the number of vehicles added. This represented the heart of the supply chain challenges, with chips and other parts severely limiting production and deliveries. This period also represented a sharp rise in marketed prices—up more than 25%, the automotive equivalent of $12 one-ply toilet paper. Following that initial shock to the system was a one-year run of inventory inflows and outflows that were fairly similar, followed by a gradual easing of supply chain issues starting in the summer of 2022. From there, the pendulum has swung to a more supply-driven orientation, albeit with a few fits and starts along the way.
As the supply picture in the industry has recovered and demand has not kept pace, the industry has been in a cycle of falling prices with a greater need for incentives as inflows outpace outflows. This trend will continue as long as there are more vehicles being added on vehicle lots than consumers buying them.
It is good to be able to look back at these key metrics and see the bigger picture for what it is and to recognize the cycles for what they represent. It is even better to understand the implications of these inflow and outflow dynamics in real time to anticipate what they mean going forward.
You can rest assured that Cloud Theory will be doing just that as part of our overall assessment of the market.