
Cloud Theory data provides OEMs with crucial insights into in-transit inventory distribution
Average Inventory Growth
Supply chain issues are still affecting vehicle production and inventory availability, but the automotive industry continues to gradually recover from its mid-2022 lows. In the 30 days leading up to March 7, 2023, the national average amount of inventory growth was 8.4% compared to the prior period. This inventory growth is not evenly distributed across the United States, however. In fact, it is quite centralized.
TOP 20 MARKETS BY INVENTORY GROWTH
And whether those markets have more or less inventory than the national average, on the ground—an indicator of market opportunity.
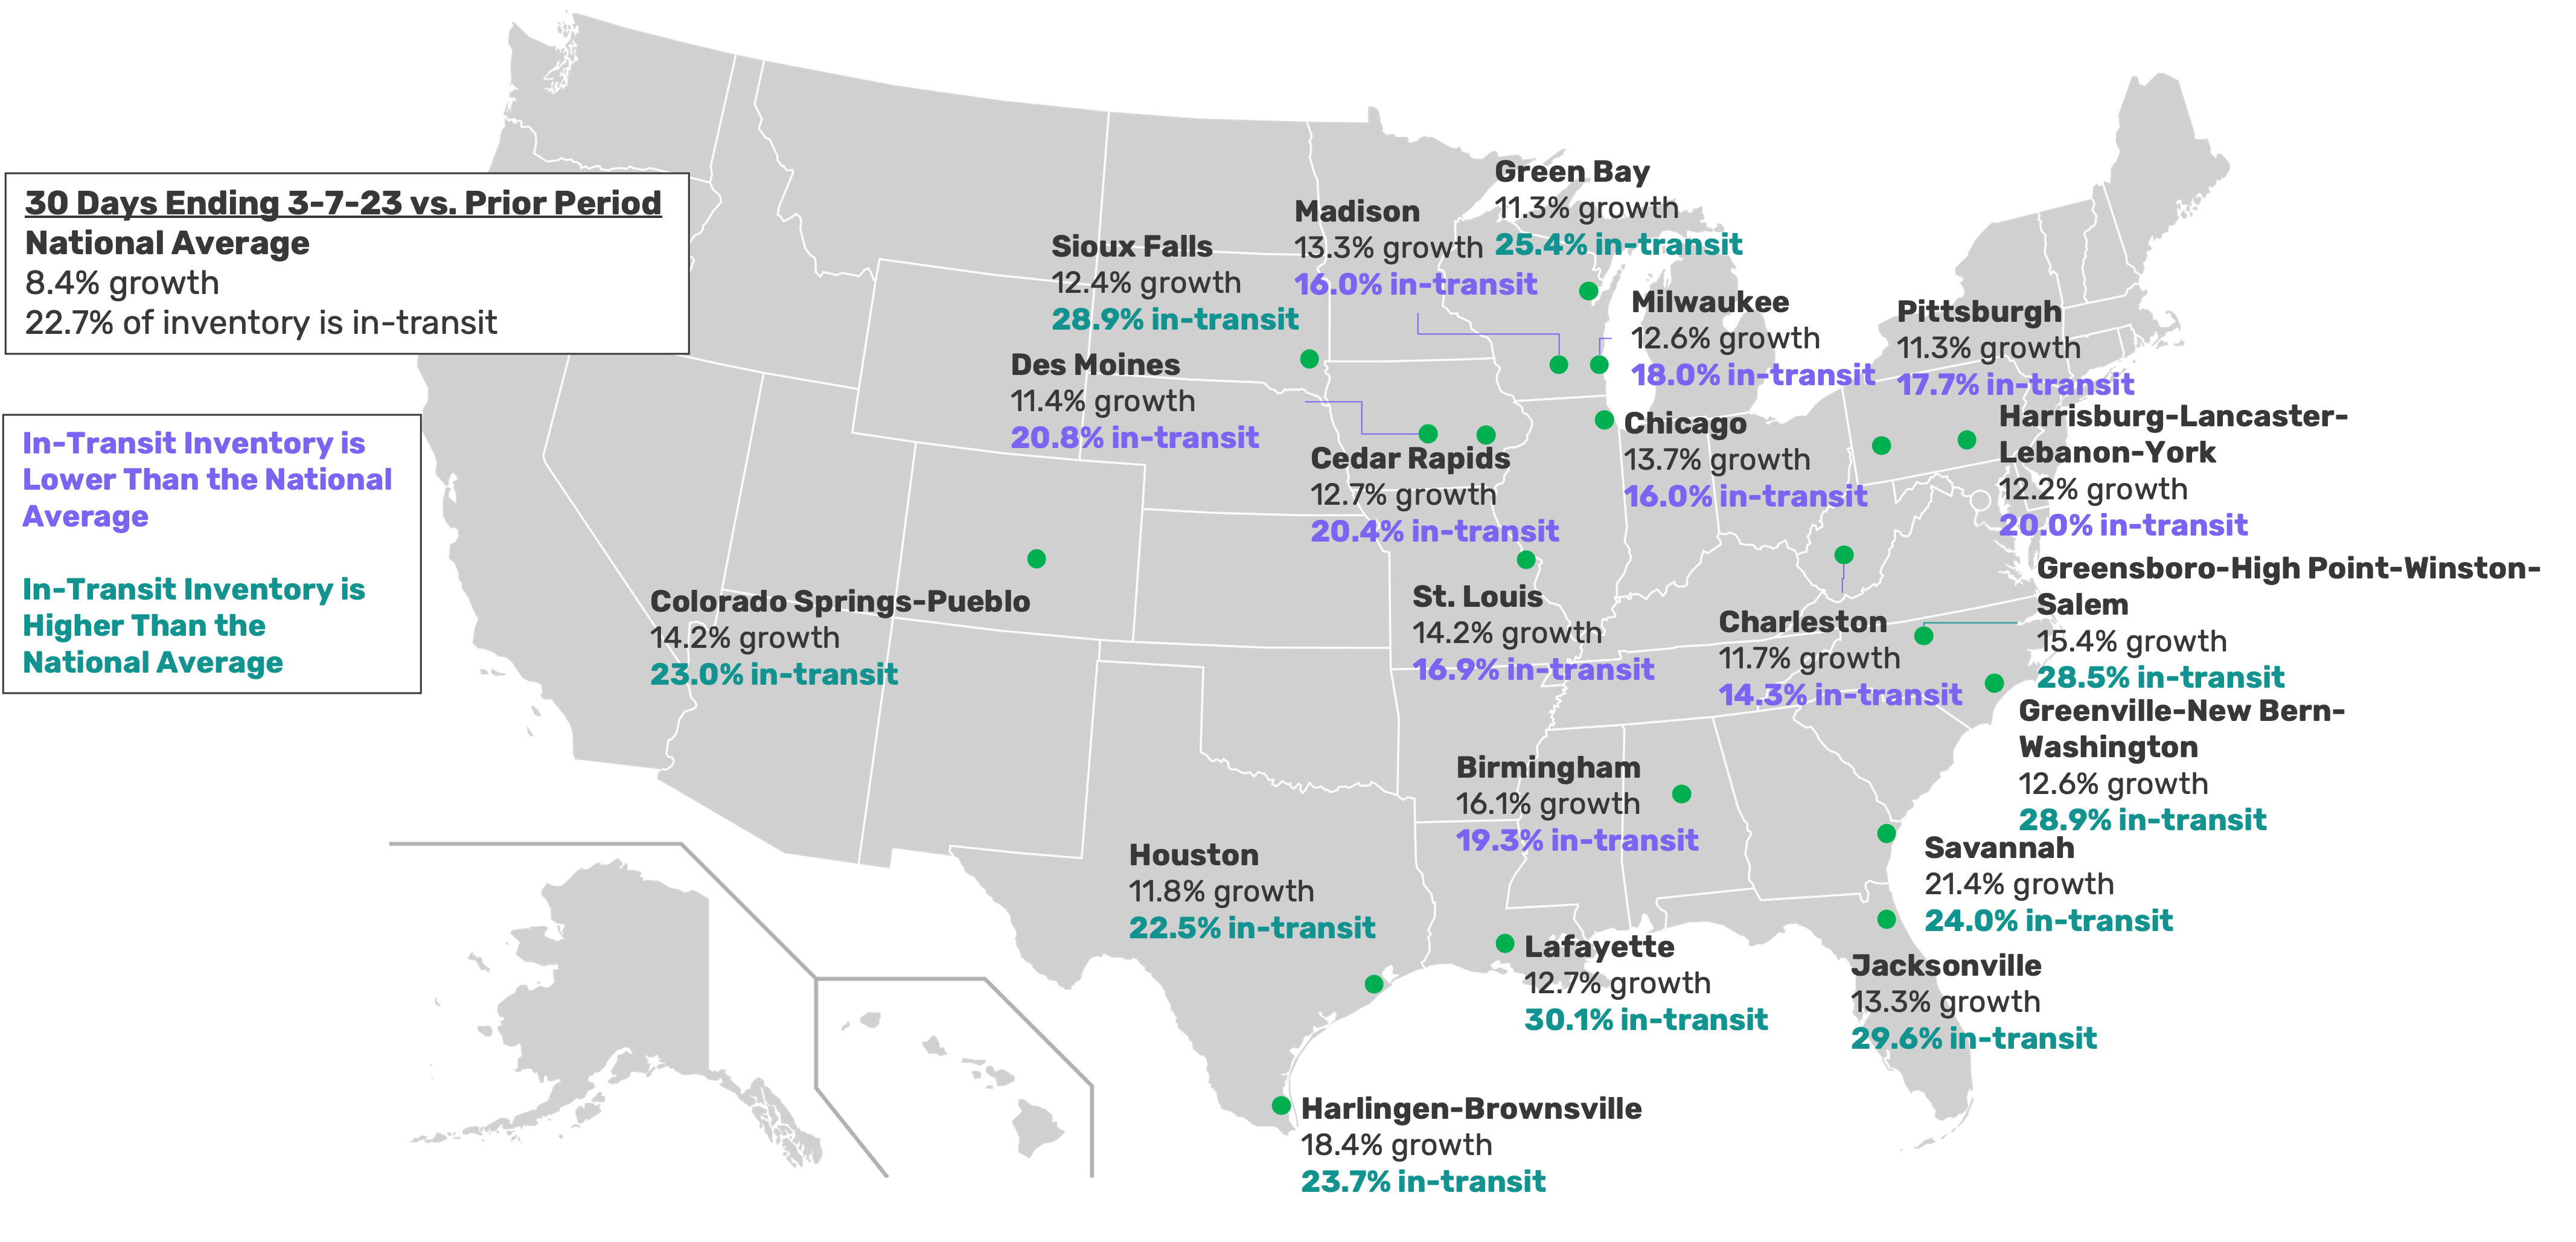
To better understand how this inventory situation is playing out, Cloud Theory evaluated the top 20 markets in terms of inventory growth, and discovered the following:
- Almost all of these markets are located in the Midwest or South
- 3 of the top 20 markets are located in Wisconsin, with two more in neighboring Iowa
- None of the top 20 markets are located west of the Rockies
From the above map, the inventory growth in the United States is not evenly spread out, with the majority occurring in the Midwest and South. There is also far more growth in the eastern half of the country than in the western, and each of the top 20 regions is in the contiguous United States.
In-Transit Inventory Distribution
For automotive OEMs and their agency partners, knowing where inventory growth is occurring is important, but knowing the location status of that inventory adds another layer of insight to help make appropriate support prioritization and messaging decisions.
Cloud Theory analyzed the inventory distribution in the top 20 growth markets and discovered that the two leading regions – the Midwest and South – have different profiles when it comes to vehicles being in-stock vs. in-transit. In the Midwest, the proportion of vehicles that are in-transit – in other words, on their way to dealer lots but not yet on the ground - is lower than the national average. This means that there is a greater percentage of cars in the Midwest immediately available for sale. The leading markets in the South, on the other hand, have a higher-than-average amount of inventory that is in-transit.
With this knowledge, OEMs can determine when and where to allocate funds to best promote available or anticipated supply, and their agency partners can adjust communications that reflect the current situation in the right place and in the right way (e.g., signaling to consumers in high percentage in-transit markets that inventory is on its way and to plan ahead to find the car that’s right for them).
This inventory growth and location status information is available for all makes and models and in every geography on a real-time basis, enabling OEMs and their agency partners to understand not only how their vehicles are faring, but the competitive context around them as well.
Cloud Theory will continue to monitor and report on both inventory growth and in-transit inventory levels over the coming months.