By Using Honda as an Example, Cloud Theory Shows Horizon’s Capabilities in Diagnosing Brand Efficiency
Identifying insights that matter is almost always an iterative exercise, one that blends the science of “Big Data” organization, curation, and modeling with the art of interpretation and recommended business actions. A strong insights toolset can be used to answer a question but at the same time provide a set of guideposts to the next set of inquiries.
Cloud Theory’s Horizon data platform is a toolset that does just that. It rests upon the foundation of billions of supply and demand data points and charts a clear path of exploration, from the broadest view of “How is my brand faring overall?” all the way down to “Do I have the right trim mix and price structure to compete in the small SUV segment in Providence, Rhode Island?”. As an example of Cloud Theory’s capability, let’s take a deep look at Honda–from national to regional, sub-regional to DMA, and from brand to model to trim.
How Efficient is the Honda Brand Nationally?
Starting at the broadest of levels, Honda is the most efficient brand in the automotive industry. As measured by Cloud Theory’s proprietary Inventory Efficiency Index—which determines if a make or model’s demand is in balance with its relative supply in the marketplace —Honda took over the top spot in July with a score of 202.8. In the past 30 days, Honda’s efficiency has gotten even stronger, with that metric currently sitting at 210.
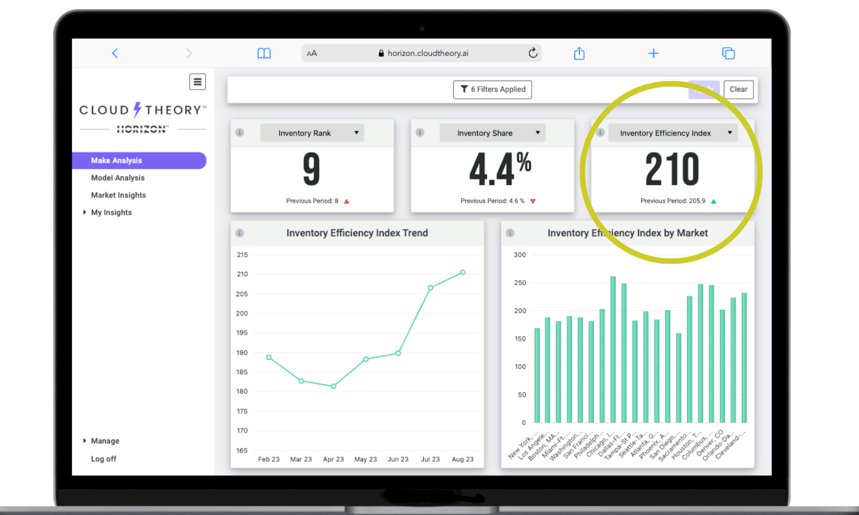
Honda’s Inventory Efficiency Index
Are There Any Models That Need Attention?
Sure, the Honda brand is highly efficient, but does that carry across their entire portfolio of models? Are there exceptions that present opportunities? To answer that question, the Horizon platform identifies the efficiency of each model in its respective competitive set using the same methodological approach—is each model’s demand in balance with its relative inventory position in each segment? In the case of Honda, one model stands out as a candidate to dig deeper into—the HR-V. Its Inventory Efficiency Index score is not bad, it is above the 100 benchmark that signifies the balance between relative supply and demand, but its mark of 117 is below that of other models in the Honda lineup and, therefore, merits further exploration.
.png?width=1800&height=1080&name=IEI%20Honda%20(1).png)
HRV Inventory Efficiency Index Score Compared to Other Honda Models
What Regions or Markets Offer the Best Opportunities to Improve HR-V’s Performance?
In the case of the HR-V, a quick regional analysis uncovers that the Eastern region—particularly the New England area—is clearly the geography to focus on further. That areas’ Inventory Efficiency Index score within the small SUV segment falls below the 100 benchmark and ranks 7th on this metric, versus above 100 and ranking second or third in other parts of the country.
Moreover, all six major DMAs in the New England area are in the bottom-right quadrant of the scatterplot chart below—indicating that each market is gaining in Inventory Share but losing in Market Share. In other words, its efficiency is on the decline.
.png?width=1800&height=1080&name=IEI%20Honda%20(3).png)
HR-V’s USA IEI Position Overall

Honda HR-V IEI Position for West and Midwest USA
Honda HR-V IEI Positions for East USA and New England, which is an area of concern for Honda.
.png?width=1800&height=1080&name=IEI%20Honda%20(6).png)
What Are the Competitive Dynamics in New England?
It’s one thing to know that New England markets have a problem. It’s quite another to be able to diagnose the competitive dynamics that are causing that problem. The good news is that the Horizon platform does that, too.
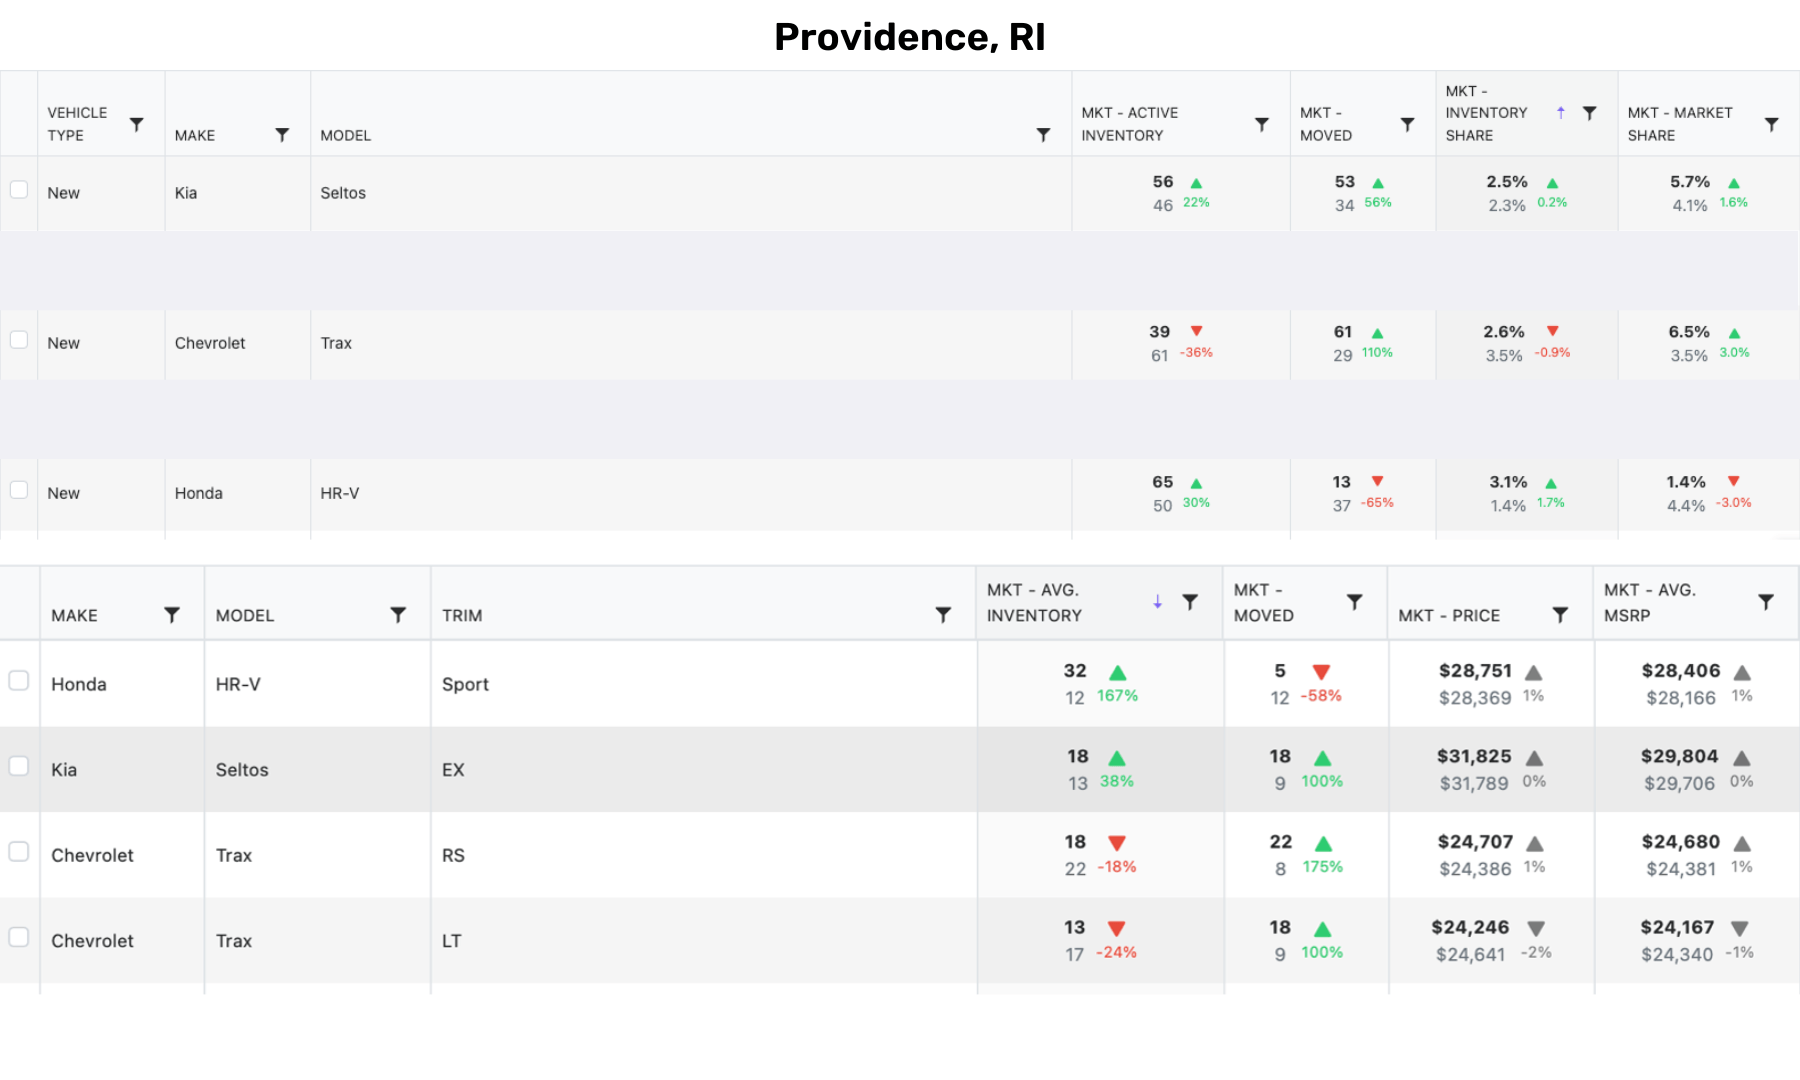
In the case of the HR-V, let’s look at the competitive model and trim-level trends that are driving this outcome in Hartford, CT and Providence, RI.
In the Hartford, CT DMA, HR-V has picked up 2.6 points of Inventory Share in the last 30 days but has lost 3.0 points of Market Share. To explain another way, it is gaining supply but losing demand. Which competitive model is contributing to this outcome the most? In this market, it is the Mazda CX-30—gaining in both Inventory Share (+3.6 points) and Market Share (+4.3 points).
At the trim level there is an across-the-board shift in opposite directions—the Select and Carbon Edition CX-30 trims are up in Average Inventory and Vehicles Moved, while HR-V’s Sport and LX trims are higher on the former but lower on the latter. It is noted that HR-V’s Marketed Prices are all above MSRP and may be exceeding a psychological barrier in doing so.
.png?width=1800&height=1080&name=marketinsights%20(1).png)
.png?width=1800&height=1080&name=Hartford%20DMA%20(1).png)
In the Providence, RI DMA, on the other hand, HR-V (up 1.7 points on Inventory Share, down 3.0 points on Market Share) is facing a different set of challengers, namely Chevrolet Trax and Kia Seltos. At a trim level, it appears that HR-V is getting squeezed from below (by Trax) and above (by Seltos) in terms of pricing.
In summary, the Horizon platform identifies the who, what, and where. It provides an elegant, iterative, and competitively contextual platform to guide this exploration—from the broadest of views to the most granular. The Horizon platform transforms “big data” into intelligent insights, organizing and visualizing them in a way that is meaningful and actionable so that decisions such as marketing and incentive allocations are clearly prioritized and easily communicated.
Or, to quote a phrase commonly attributed to Albert Einstein, “If you can’t explain it simply, you don’t understand it well enough.”
About Cloud Theory’s Inventory Efficiency Index Scoring
Cloud Theory's patent-pending Inventory Efficiency Index provides a previously unavailable real-time view of market-relevant supply and demand of all makes and models across all geographies. Key decision-makers can use the IEI to confidently allocate valuable marketing and incentive dollars to locations requiring a boost in demand or reallocate vehicles to locations that are moving inventory more efficiently. Cloud Theory's Inventory Efficiency Index assigns scores to vehicle makes based on current active inventory and sales data compared to competitors.
- A score of 100 means that an OEM's demand is in balance with its relative supply in the marketplace.
- A score above 100 indicates that a make or model is selling its inventory more efficiently than average.
- A score below 100 means that there are opportunities to bring demand into better alignment with supply (or vice versa).